Test Date 25 November 2022
Location 667b Great South Road, Penrose
1. Test setup
1.1. Loading device
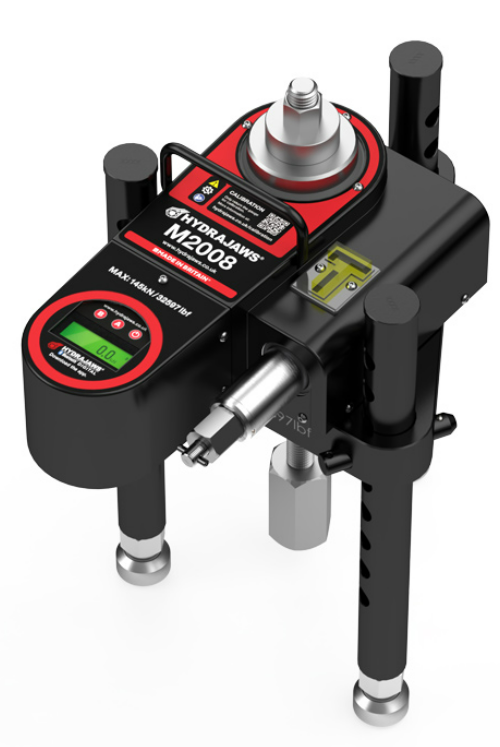
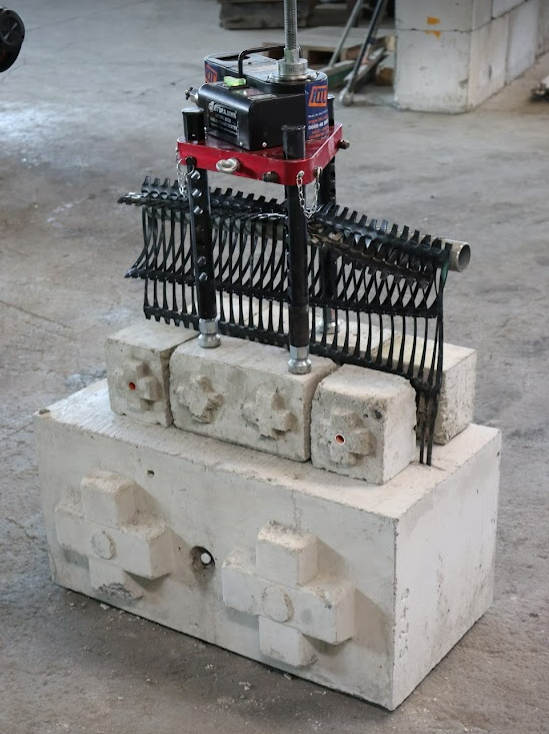
The Hydrajaws Model 2008 device was used as the loading device. The device has a loading capacity of up to 145 kN and is normally used for heavy duty pull testing of anchor bolts. The device is shown below.
|
|
|
Fig 1. Loading device |
1.2. Loading pipe
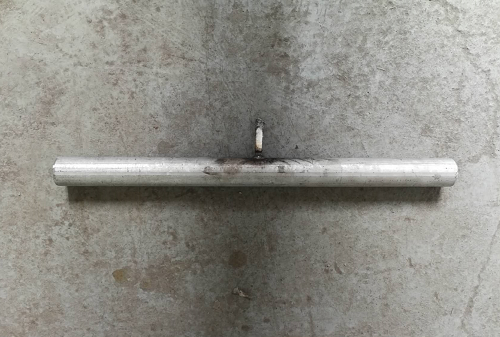
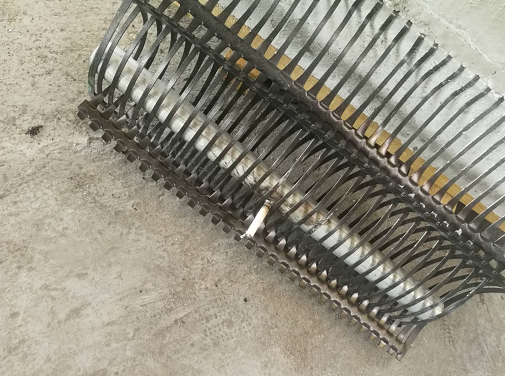
A 50 mm diameter steel pipe was used as a mean to transfer the pull out force from the loading device to the embedded geogrid. A 12 mm diameter threaded rod was welded at the middle of the pipe, which was used to attach the loading device to the loading pipe. The loading pipe acted similar to a bodkin in actual applications, and was also used to stitch an extra piece of geogrid to the casted one. The loading pipe and the test sample after stitching the extra piece of geogrid are shown below.
|
|
|
|
Loading pipe |
Stitching the extra piece of geogrid |
|
Fig 2. Test setup before fixing the loading device |
|
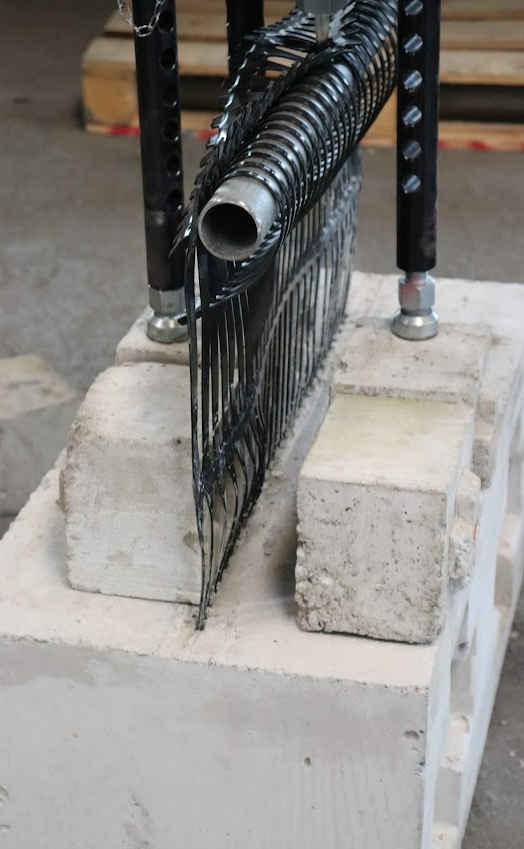
After stitching the geogrid, the loading device was mounted at the backside of the block and elevated using small concrete blocks as shown below.
|
|
|
Fig 3. Loading device mounted at the backside of the block |
2. Load scheme
The short-term tensile strength of Tensar RE580 is 137.3 kN/m width. The ultimate long-term strength for 120 years is 65.27 kN/m. The tested specimen had a width of 650 mm; therefore, the short-term target load is 89.3 kN and the ultimate long-term load is 42.4 kN.
AS/NZS 1170.0 Appendix B sets criteria for testing to satisfy the targeted limit state. The following requirements are noted:
- The target load should be equal to the relevant limit state.
- The test specimen is deemed to comply with the requirement if it is able to withstand the ultimate limit state loading for 15 minutes.
- The load should be applied in a uniform rate such that the duration of the test is not less than 5 minutes.
To comply with the above requirements, the ultimate limit state load was applied in 10 equal intervals. The load was maintained at the end of each interval for 5 minutes before moving to the next loading step. At the ultimate limit state load step, the load was maintained for 15 minutes. The load was then increased following 10 kN intervals (each maintained for 5 minutes) aiming to reach failure of the maximum capacity of the loading device.
3. Results and observations
3.1. Ultimate limit state
The test observations up to the ultimate limit state load value are shown in the below table.
|
Table 1. Ultimate limit state test observations |
|
|
Load (kN) |
Observation |
|
0 |
|
|
4.24 |
No signs of failure or stretching of geogrid |
|
8.48 |
No signs of failure or stretching of geogrid |
|
12.72 |
No signs of failure or stretching of geogrid |
|
16.96 |
No signs of failure or stretching of geogrid |
|
21.2 |
Concrete cracking near the edges of the geogrid |
|
25.44 |
No changes. Slight propagation of cracks |
|
29.68 |
No changes. Slight propagation of cracks |
|
33.92 |
No changes. Slight propagation of cracks |
|
38.16 |
No changes. Slight propagation of cracks |
|
42.4 |
No changes. Slight propagation of cracks |
3.2. Failure test
After reaching the ultimate limit state, the load was increased until the maximum capacity of the loading device, which is 145 kN as recommended by the manufacturer. The observations are listed in the below table.
|
Table 1. Ultimate limit state test observations |
|
|
Load (kN) |
Observation |
|
80 kN |
The stretching of the geogrid was visible at the middle. However, since measuring the length was hard with the test setup, it is not possible to decide the load at which the stretching started. |
|
130 kN |
Cracking sounds were heard. However, other than the 2 cracks near the edge of the geogrid, no other cracks were visible. |
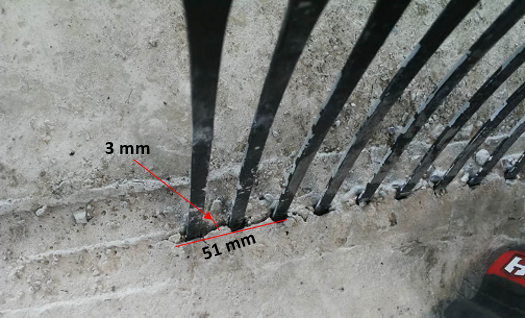
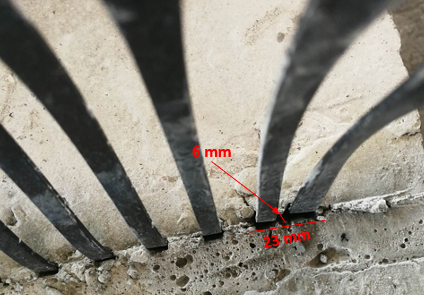
The cracks near the edge of the geogrid at the end of the test and after removing the loading device are shown in the figure below.
|
|
|
|
Left side crack |
Right side crack |
|
Fig 4. Cracking near the edges of the geogrid |
|
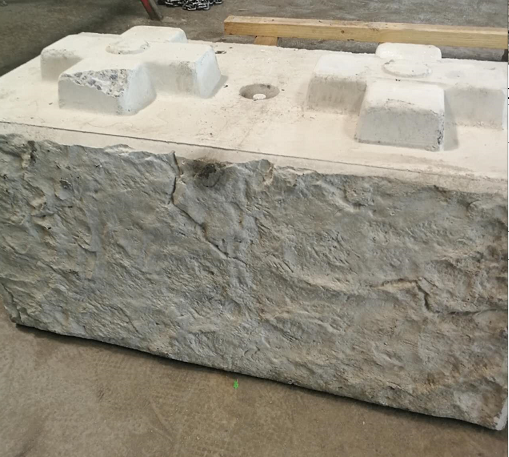
The face of the block was inspected to check if the cracks propagated to the other side. No signs of cracking as shown in the below figure.
|
|
|
Fig 5. The face of the block after testing |
Geogrid stretching was observed at the middle of the geogrid. This means that most of the applied load was concentrated at the middle when the geogrid started stretching. This can also explain the slow propagation of the cracks near the edge of the geogrid. The status of the geogrid at 80 kN is shown in the figure below.
|
|
|
|
Overall view of the geogrid at 80 kN |
The middle part of the geogrid at 80 kN |
|
Fig 6. Status of the geogrid at 80 kN |
|